Advance Nanotek Leading Indicators
04 October 2019Advance Nanotek (ASX:ANO) is a materials company predominately manufacturing zinc oxide powder and dispersions that are commonly used in sunscreens and cosmetics. Zinc-based mineral sunscreens are gaining popularity due to heightened awareness of sun damage, increased scrutiny of chemical sunscreen filters including environmental concerns, allergic responses and unknown long-term health impacts. Zinc-based products are historically associated with a strong white-cast when applied to skin which is often undesirable. Modern formulations however are cosmetically appealing, leaving less of a white-cast than previous, with many zinc-based products claiming to dry clear or invisible.
Advance Nanotek has been riding this wave - as seen by the meteoric rise in the share price - making it one of the best performers of FY19. Their background story, qualitative and quantitative analysis has been covered in detail on a few places across the web1. There have also been some divided opinions2 especially on the topic of management communications.
In this post, I'll be highlighting a couple of leading indicators and how I utilise them to guide future expectations. All figures mentioned are from free and publicly available sources.
US Shipping Data
US shipping data seems to be something that people can get their hands on3. With North America accounting for over 50% of the company's total sales, this provides a good indicator of the current sales momentum.
There are several paid services that provide data including Import Genius, Panjiva and Seair to mention a few.
If you're a cheapskate like me, it's possible to grab enough data from the sample marketing pages to make sense of things. I've found Import Genius one of the better ones - enter Antaria site:importgenius.com in your favourite search engine and hit the first organic result. Note that Advance Nanotek goes by the trading name "Antaria" when shipping products.
Here's a couple of charts I've assembled by piecing together shipping data from multiple sources. The data covers shipment arrival dates spanning 20-Nov-2018 to 19-Sep-20194.
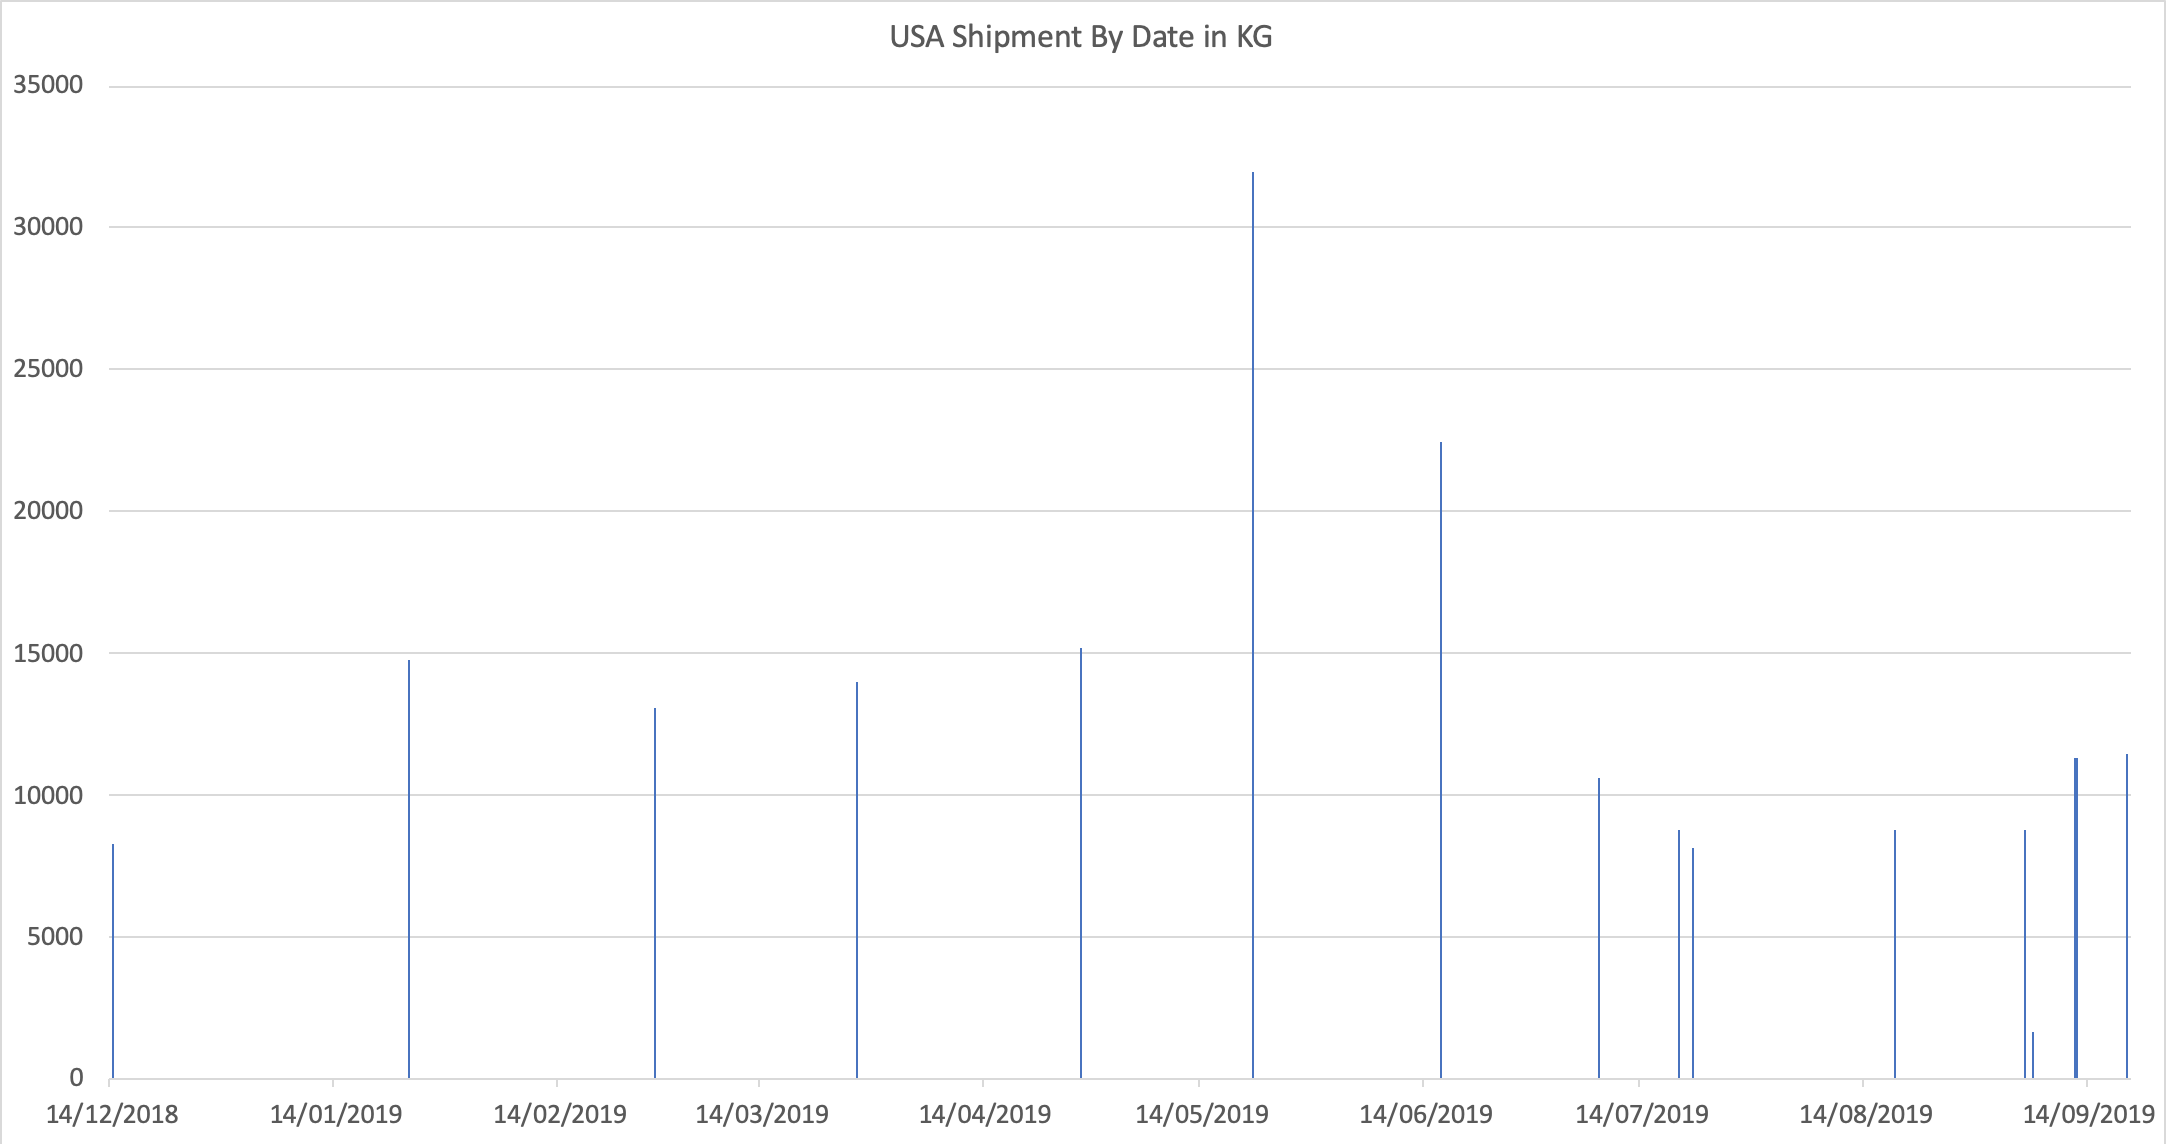
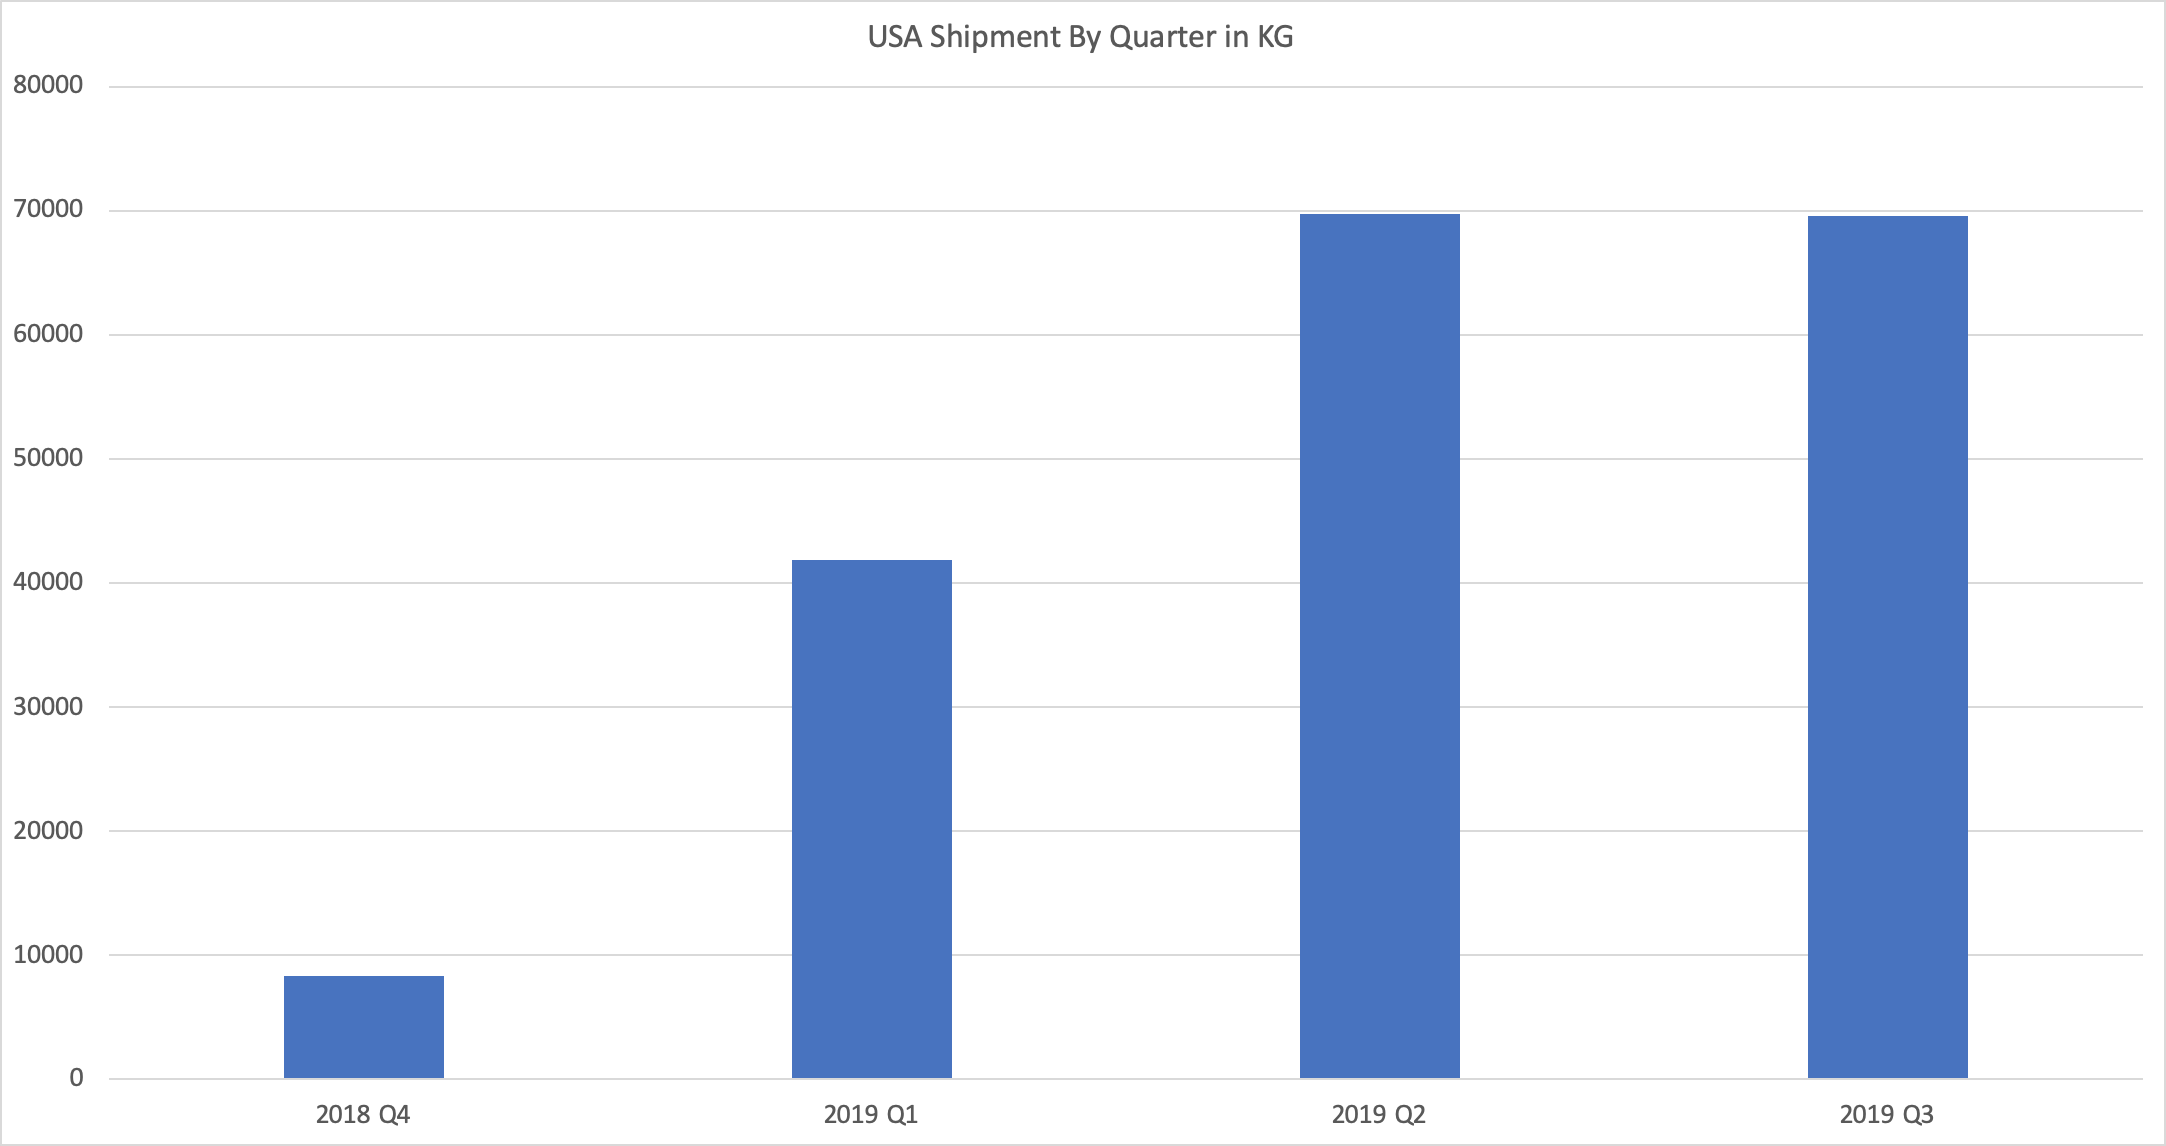
This is suggesting that the 3rd quarter has seen continued momentum in US sales and there's no indication of a drop-off.
The key caveats to be aware of:
- At the time of publishing, the last shipment was recorded on the 19th of September. I'm unsure how laggy these shipping records are, and whether there will be further data to round off the quarter.
- The company recognises revenue when the customer takes control of the product. The dates specified are when the shipment arrives at the docks. There's a chance that some of the shipments may actually be recognised in the following quarter due to the further logistics required to get it to the end customer.
- Doesn't take into account air freight, products manufactured in the US, or products routed via different suppliers or distributors. So take any insights derived with a large grain of salt.
Inventory Leads Revenue
If I'm to make the assumption that inventory levels are a leading indicator for future revenues, then the next half year revenues can be extrapolated using simple ratios and assumptions. Below are revenue and inventory figures5 for the past four halves, and an estimate for the first half of FY20. I've made the assumption that revenues will be 4.0 times higher than current inventory levels - a ratio that has held for the last two halves.
| 1H FY18 | 2H FY18 | 1H FY19 | 2H FY19 | 1H FY20 | |
|---|---|---|---|---|---|
| Revenue ($'000) | 2,503 | 4,081 | 4,743 | 7,517 | 13,438 |
| Inventory At Cost ($'000) | 1,248 | 1,228 | 1,839 | 3,359 | - |
| Revenue / Previous Inventory | - | 3.27 | 3.86 | 4.09 | 4.00 |
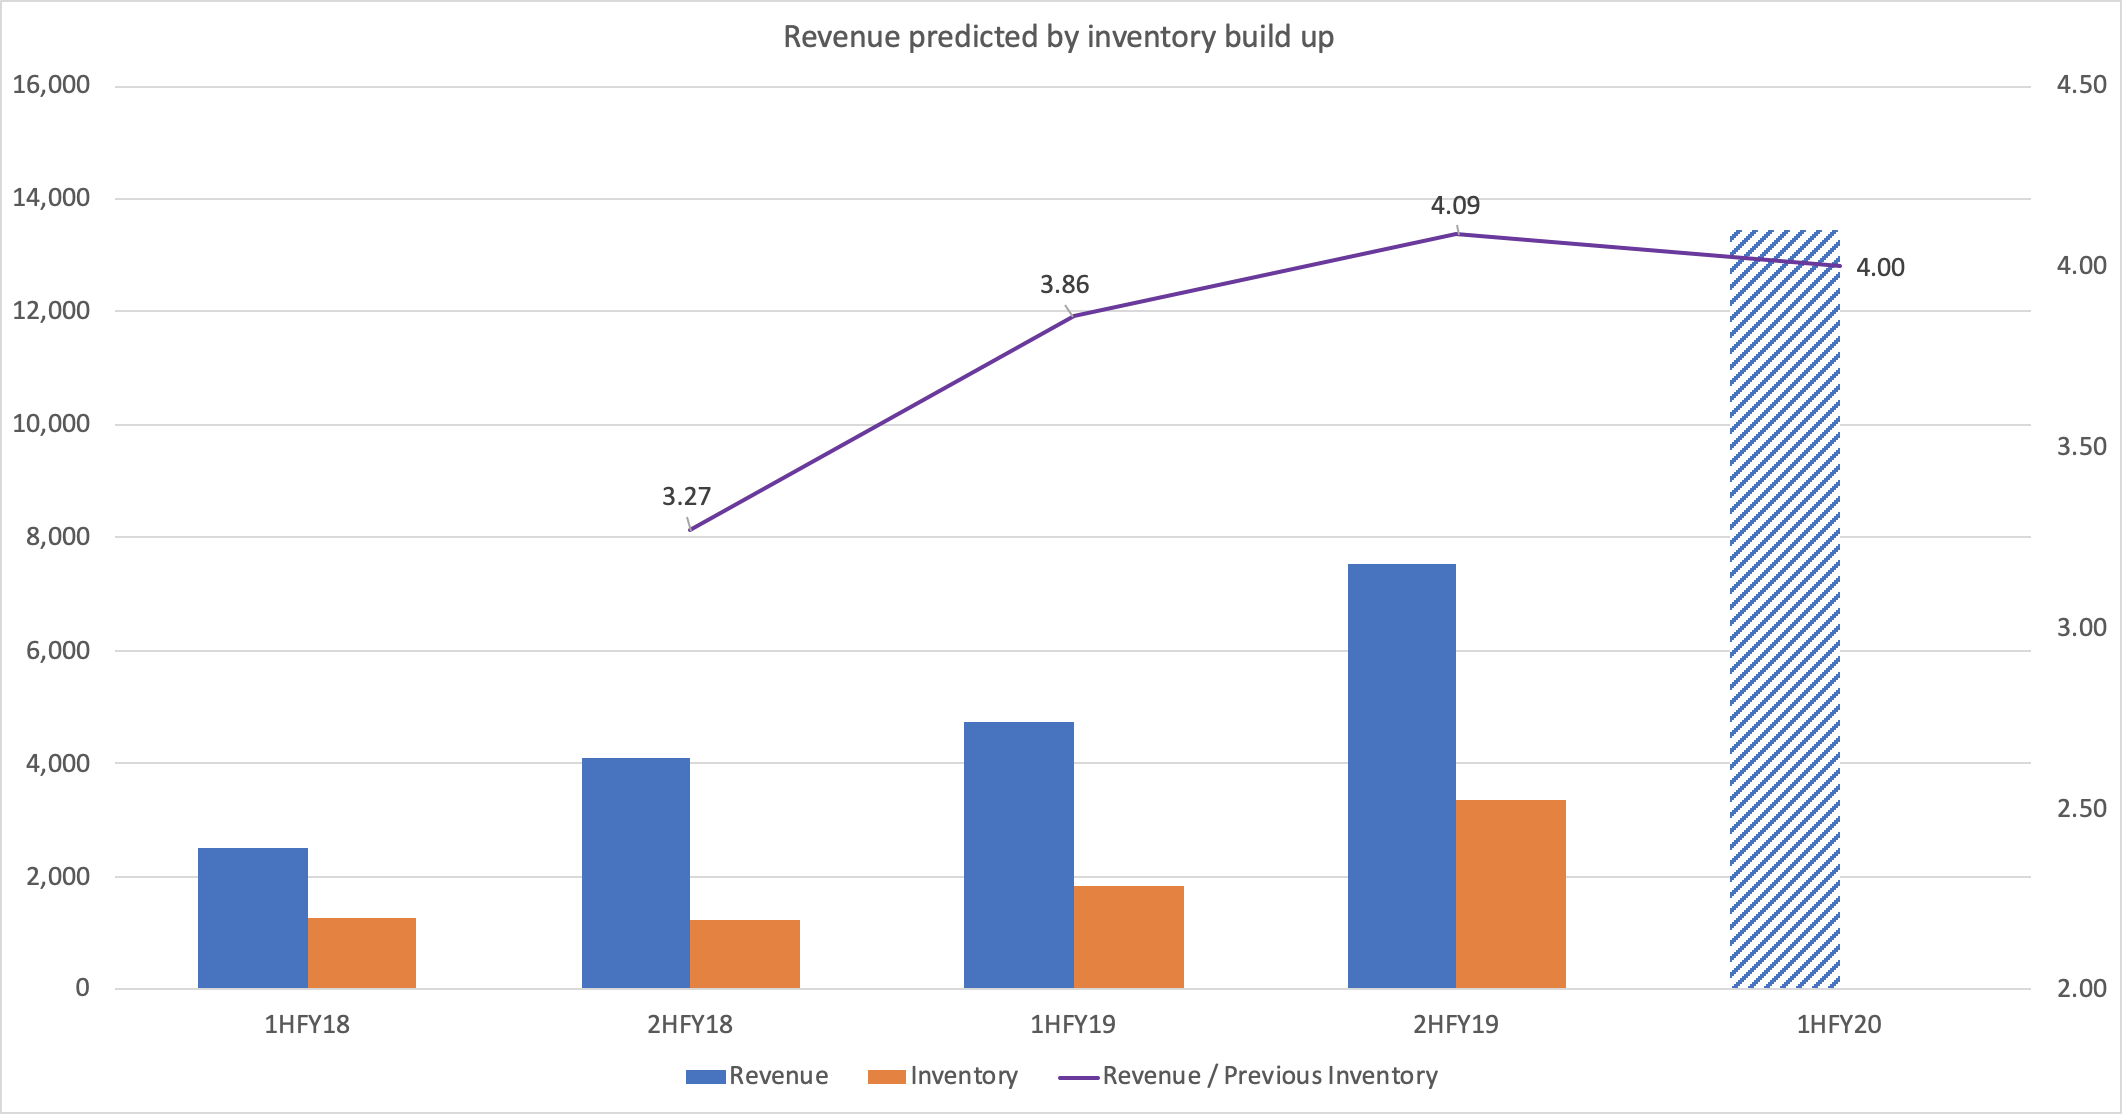
The $13.4m revenue estimate for 1H FY20 aligns with management's guidance of $30m for the full year.
This will provide an early indicator of what to expect in the next half year result due in February next year. One of the first things I'll be doing when the results hit, is grabbing the inventory figure and multiplying it by 4.0 to generate an early guess at the 2nd half revenues.
For the record, I'm expecting EBIT for 1H FY20 to come in at around $5m, up almost 200% year on year. This is based off the revenue estimate above and a bunch of my own assumptions on gross margins and costs6.
Again there are some major caveats when using this approach:
- It's assuming that the company is not stockpiling inventory for future demand spikes.
- It's assuming the company is managing inventory levels in a consistent manner.
- The estimate doesn't take into account different product and inventory mixes.
Wrapping up
Leading indicators can provide a great heads up on what to expect, and provide a starting point for modelling future profits. What's useful will differ between different industries, different companies and the data available. It's important to think of how they're applied, how useful they are, and understand the caveats involved.
ANO last traded at $5.69.
Disclosure: At the time of publishing I hold shares in ASX:ANO. Holdings are subject to change at any time.
-
On Strawman, especially posts from Wini and Anthill. It has also been covered in detail on the Ethical Equities' paid subscription service. ↩
-
Whether Advance Nanotek is a pump, a stonk, or GARP, is of great debate. And there's usually plenty on the
$ANOcash tag on Twitter, after a price sensitive announcement on a Friday afternoon. ↩ -
I haven't been successful in finding up-to-date raw data. If you know where to find it, please let me know! ↩
-
The 2018 Q4 data is likely to be incomplete, so the number is probably too low. ↩
-
Figures, with the exception of the FY20 forecast, are from the half yearly and annual reports released by the company. ↩
-
A big variable is the "Corporate Costs" line which includes performance options adjustments and bonuses. I'm assuming this item will be minimal for this half as per 1H FY19. It was a big reason why the 2H FY19 bottom line result was subdued. ↩